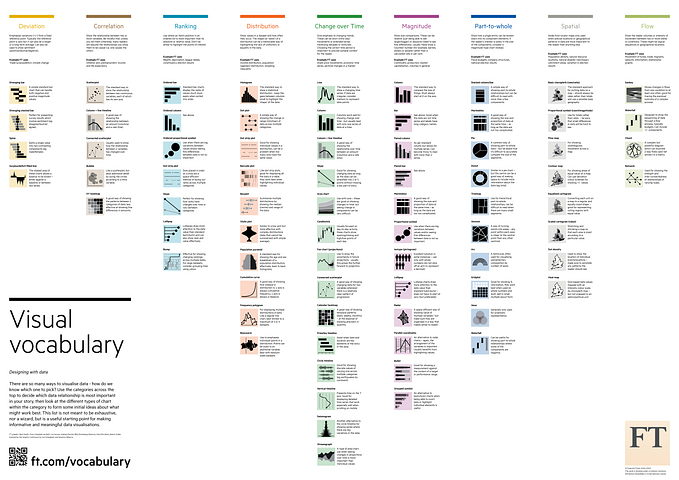
Render data into visuals
Visuals ~ absorb info quicker than lists, tabular data
- Bin to prevent rendering every single point. The binning algorithm isn’t always obvious. Coarse binning in some parts, no binning in others.
- Binning decreases resolution.
- If data exists on very different scales, then create different axes, breaks in an axis, or take logs but these are subjective decisions and can create misleading or bad representations
- If there are many different features that are plotted on independent axes, aka dimensions, there is subjective decision-making on which slice(s) to plot
- When we set up dashboards that update automatically, incoming data can be different than we expect
- If set up to automatically render with subjective decisions in place → that can slow down the rendering or not be in the limits of the axes or just not be the best representations → reasonable decisions can be made with some acceptance for loss of accuracy. Maybe no acceptance for slow rendering.
Real Estate Data
# Source: https://www.kaggle.com/datasets/ahmedshahriarsakib/usa-real-estate-dataset
# Data format : csv file
# 2.2 million rows
# Load 200 rows, pass that as an argument
# Visually examine the distribution of data in numerical columns
# The data file and the code should be in the same directory
Due to the outlier, the visual is not as informative as could be.

Fields in the dataset: numerical and categorical

Previously sold date is available. No dates on when a house was listed and when it sold. Data not directly useful to predict time to sell based on other features.

Predict house price based on data available in all other columns (partial decision for the market value of a house)
- Conversion of categorical data to numerical representation: ordinal encoding
R² value — intuitively accessible measurement for how good is the prediction
As a metric, R² is normalized because everytime you add a datapoint to the collection of entities being summed, there is also an addition to corresponding division.
Whereas MSE is normalized by number of samples, but not normalized by the magnitude of the values in the data. Therefore, MSE does not have a finite range. Relating performance to the metric value is less intuitive at first glance.
For example, a result

Source: Stats text books and sci-kit learn docs.
https://scikit-learn.org/1.5/modules/model_evaluation.html#mean-squared-error

vs. mean squared error

Text Embeddings
from sentence_transformers import SentenceTransformer
model = SentenceTransformer(‘all-MiniLM-L6-v2’)
- Embed text phrase to vector
- Take the dot product of question vector and answer vector.
- Effect of language: 1) sign one that the german embeddings may not be as good. No outliers in German lang. Although there should have been.
- In English, there are a few outliers. Below < 1 . Manual checking shows that the outliers are correct in that there is no overlap between the question and the answer.


- We made a comment about the outliers. What about the main part of the histogram, where most of the data is, what does it tell us?
- Would testing for outliers be sufficient to test different embedding models on a small set of custom data?
- The question contains some key words and the answers are much longer, contain those key words and have many other words. So presumably, the answer embedding a more diluted embedding. The more precise embedding (question) and the diluted embedding have a dot product near 0.5 say. This indicates some relationship.
- So for kicks, for English, let me take the product between questions and incorrect answers. The hypothesis is that the distribution shifts left.
Qualitatively looking at distributions can miss smaller differences. Here are 4 metrics, 2 for similiarity between a list of numbers (a distribution) and 2 measuring a level of difference.
Similarity: Correlation and Cosine Similarity. Correlation of 1 and cosine similarity of 1 both indicate that the two distributions are the same. Range is from 0 to 1.
What would be the difference between measuring correlation and cosine similarity?
Difference Measurement: Wasserstein distance and KL divergence, aka entropy.